Markets
Animation: Berkshire Hathaway’s Holdings Since 1994
Article/Editing:
Visualizing Berkshire Hathaway’s Holdings Since 1994
If you’re a long-time follower of Visual Capitalist, then you probably know that we’re big fans of Warren Buffett.
We’ve written numerous articles about the world-famous investor, covering everything from his early years to his most famous quotes. As one of the wealthiest and most influential investors in the world, he’s an important market player to keep track of.
As our latest addition to the Warren Buffett archives, this animated video by Sjoerd Tilmans highlights three decades of Warren Buffett’s investments. It shows what his holding company, Berkshire Hathaway, has been invested in since 1994, using data from the company’s financial reports.
A Rocky Start: The Early Years of Berkshire Hathaway
Before becoming the multinational conglomerate that it is today, Berkshire Hathaway was once a massive (yet struggling) textile company in Rhode Island.
Buffett first invested in the company in the late 1950s, when the company’s shares were declining. By 1964, things still hadn’t picked up for the company, and Buffett was ready to cut his losses and move on.
But when industrialist Seabury Stanton, the CEO of Berkshire Hathaway at the time, offered to buy Buffett out for less than the price he’d originally promised, things got interesting. Buffett was so furious by the offer that instead of selling his shares, he bought more, eventually taking control of the company and letting Stanton go.
The textile company never recovered, and Berkshire Hathaway eventually became Buffett’s holding company for other investments. He estimates that his investment in Berkshire Hathaway ultimately cost him $200 billion.
A Brighter Future: Berkshire Hathaway Now
Despite its tumultuous past, Berkshire Hathaway is now associated with tremendous financial success. In 2021, the conglomerate generated over $276 billion in total revenue.
And Buffett has about a 38% stake in the company, which means he’s one of the wealthiest people on the planet. As of today’s publication date, his net worth sits at $93.3 billion.
In the long run, Berkshire Hathaway has outperformed the market by a landslide. Here’s a look at the holding company’s compounded annual gain, and overall gain, compared to the S&P 500:
| Berkshire Hathaway | S&P 500 | |
|---|---|---|
| Compounded Annual Gain (1965-2021) | 20.1% | 10.5% |
| Overall Gain (1964-2021) | 3,641,613% | 30,209% |
Note: These figures are from Berkshire Hathaway’s (BH) Annual Report. BH’s market value is after-tax, and S&P 500 is pre-tax, including dividends.
According to the conglomerate’s website, it owns 62 different companies outright, including big names like GEICO, Dairy Queen, Kraft Heinz, and Duracell, and also has large investments in companies like Apple, Wells Fargo, and Coca-Cola.
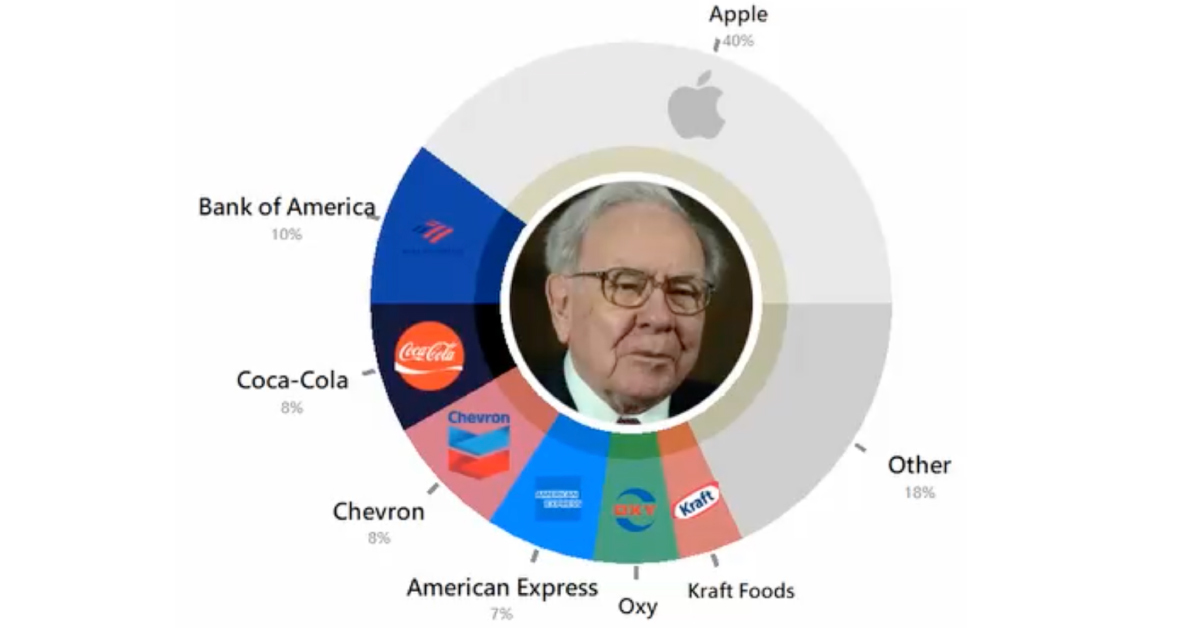
However, as the graphic above indicates, the exact composition of its portfolio has certainly evolved over the years. As of June 2022, here’s a breakdown of Berkshire Hathaway Holdings:
| Company | Value (Millions) | % of Portfolio |
|---|---|---|
| Apple | $122,337 | 40% |
| American Express | $21,016 | 7% |
| Bank of America | $31,444 | 10% |
| Coca-Cola | $25,164 | 8% |
| Chevron | $23,373 | 8% |
| Kraft Foods | $12,419 | 4% |
| Other | $71,559 | 23% |
It’s a well-balanced portfolio of big tech, banks, and consumer goods. Despite being 92 years old, Buffett remains the chairman and CEO of the conglomerate.
As for future succession plans, Greg Abel has been selected as the successor to Buffett as CEO, while the the Guardian has reported that Buffett’s oldest son Howard is expected to take over as non-executive chair when his father is no longer in charge.

This article was published as a part of Visual Capitalist's Creator Program, which features data-driven visuals from some of our favorite Creators around the world.


Markets
The Growth of a $1,000 Equity Investment, by Stock Market
In this graphic, we’ve visualized stock market growth by country over the past five years using major indices.
Visualizing Stock Market Growth by Country
This was originally posted on our Voronoi app. Download the app for free on iOS or Android and discover incredible data-driven charts from a variety of trusted sources.
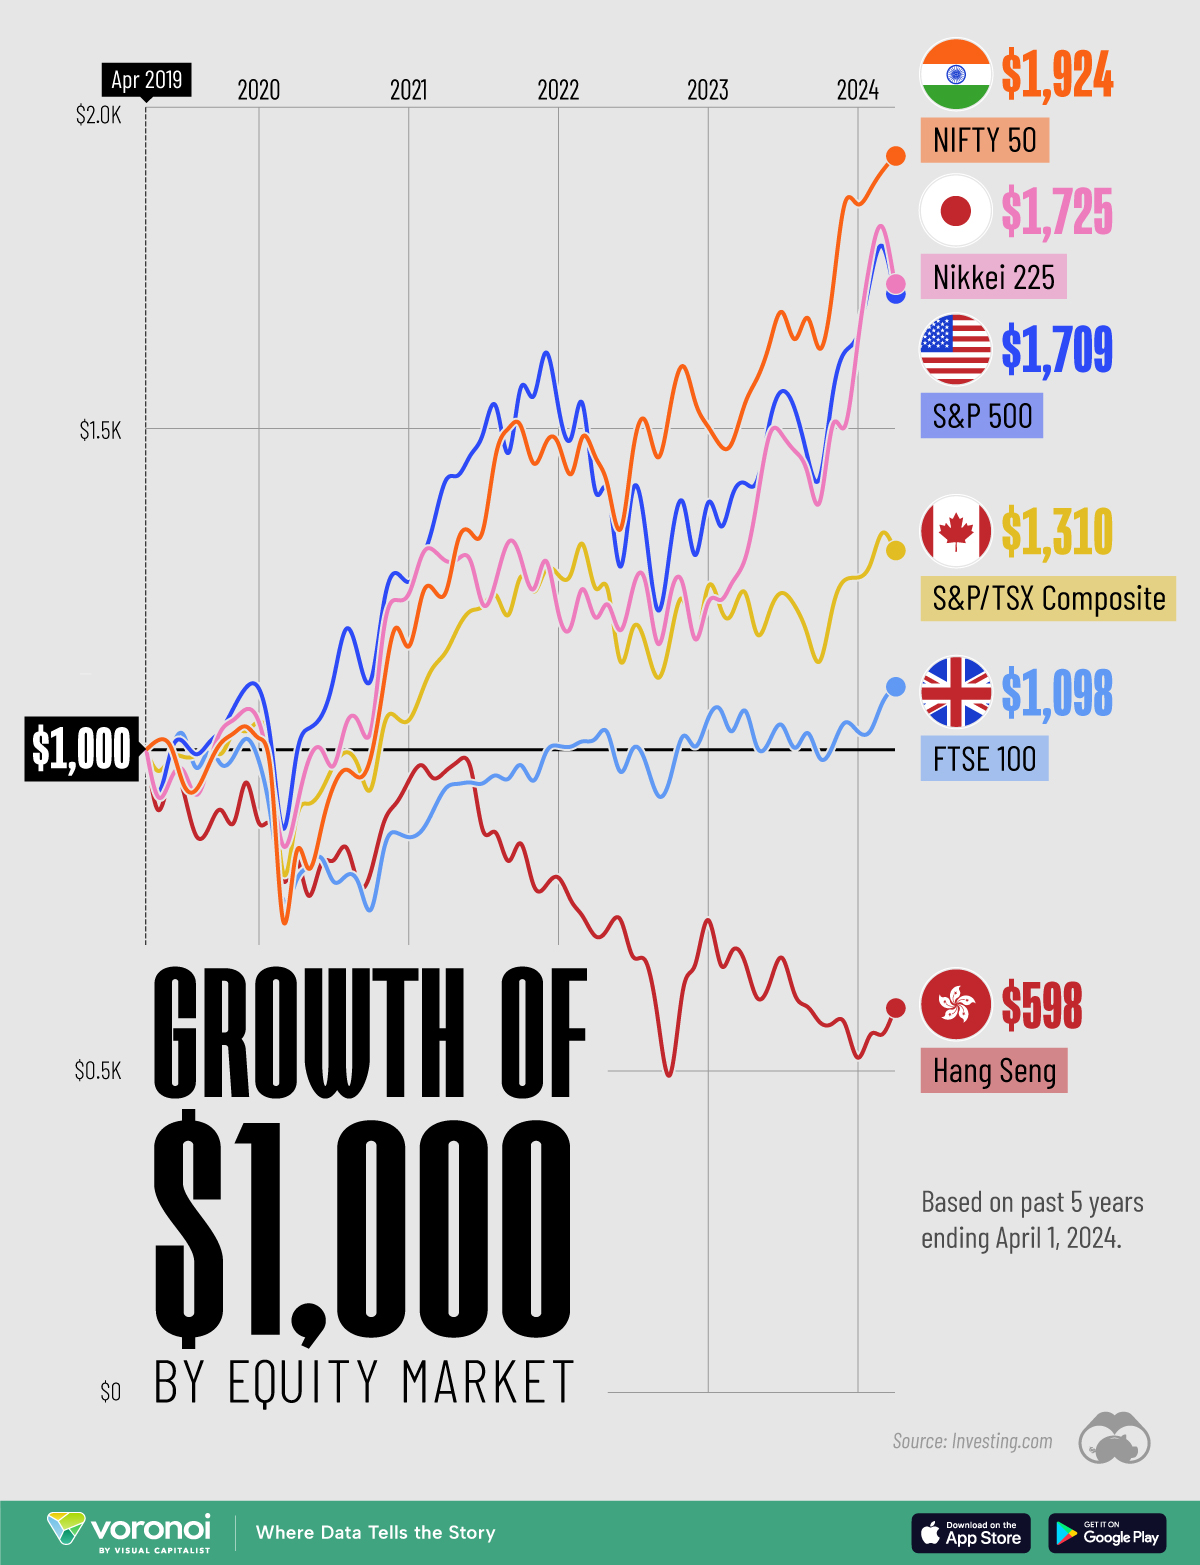
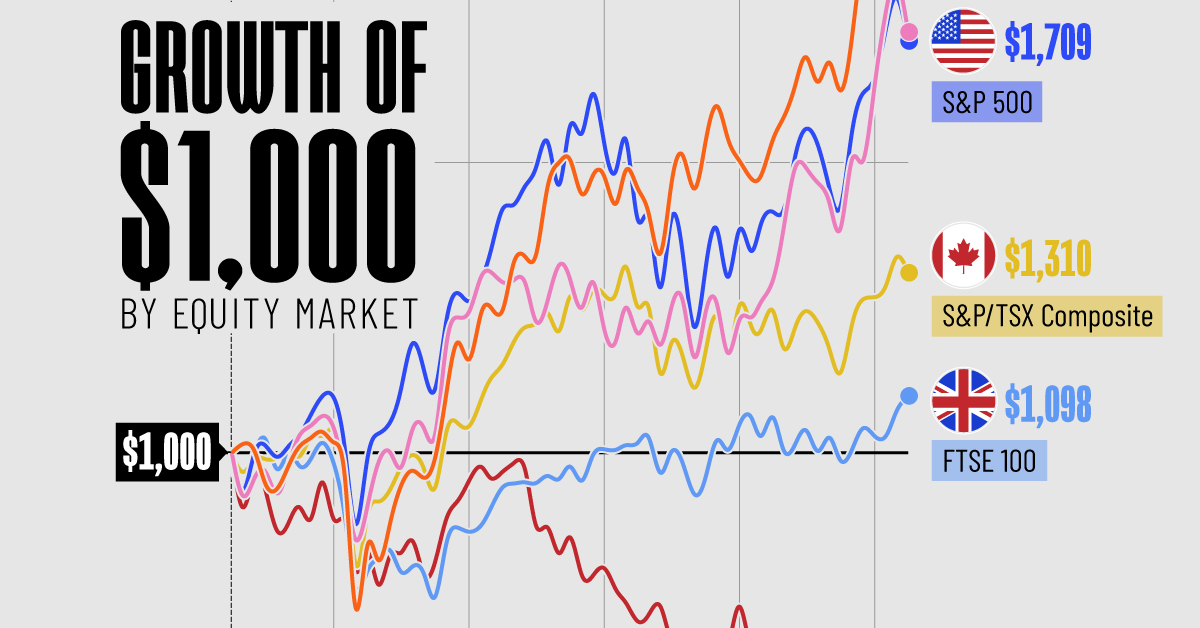
In this graphic, we show the change in value of a $1,000 investment in various leading equity indexes from around the world. This data was sourced from Investing.com, and covers a five-year period from April 2019 to April 2024.
See the following table for the five-year annual return figures of the indexes shown above.
| Index | 5-Yr Return as of April 1, 2024 |
|---|---|
| 🇮🇳 NIFTY 50 | 92.4% |
| 🇯🇵 Nikkei 225 | 72.5% |
| 🇺🇸 S&P 500 | 70.9% |
| 🇨🇦 S&P/TSX Composite | 31.0% |
| 🇬🇧 FTSE 100 | 9.8% |
| 🇭🇰 Hang Seng | -40.2% |
In terms of stock market growth by country, India (represented here by the NIFTY 50) has impressively surpassed both the U.S. and Japan.
What is the NIFTY 50?
The NIFTY 50 is an index of the 50 largest and most actively traded Indian stocks. Similar to the S&P 500, it represents a range of industries and acts as a benchmark for investors to gauge the performance of the country’s broader stock market.
What’s Going on in India?
India’s multi-year bull market has led to several records being shattered in 2023. For example, the country’s total stock market market capitalization surpassed $4 trillion for the first time, while India-focused ETFs pulled in net inflows of $8.6 billion over the year.
A primary driver of this growth is the country’s fast-rising middle class. According to a report by Morgan Stanley, this “once-in-a-generation shift” will result in India having the third largest stock market globally by 2030, presumably behind the U.S. and China.
Japan Also Breaks Records
Japanese equities (represented in this graphic by the Nikkei 225) slightly outperformed the S&P 500 over the past five years. The index, which represents the top 225 companies on the Tokyo Stock Exchange, recently set a new record high for the first time since 1989.
Japanese companies have reported strong earnings as of late, partly thanks to a weak yen, which benefits many of the country’s export-reliant companies.
Learn More About Global Markets From Visual Capitalist
If you enjoyed this graphic, be sure to check out The World’s Biggest Stock Markets, by Country, which provides a unique perspective on country-level market capitalizations.

-

 Energy6 days ago
Mapped: The Age of Energy Projects in Interconnection Queues, by State
-

 AI2 weeks ago
Visualizing AI Patents by Country
-

 Markets2 weeks ago
Economic Growth Forecasts for G7 and BRICS Countries in 2024
-

 Wealth2 weeks ago
Charted: Which City Has the Most Billionaires in 2024?
-

 Technology2 weeks ago
All of the Grants Given by the U.S. CHIPS Act
-

 Green1 week ago
The Carbon Footprint of Major Travel Methods
-

 United States1 week ago
Visualizing the Most Common Pets in the U.S.
-

 Culture1 week ago
The World’s Top Media Franchises by All-Time Revenue